Nearly four years ago, on 11 March 2020, the World Health Organization (WHO) officially declared that “Covid-19 could be characterised as a pandemic.”[1] The series of events leading up to this remarkable statement began only ten weeks earlier (31 December 2019) when the WHO “picked up media reports of … a cluster of cases of pneumonia of unknown cause in Wuhan.”[1] As a result, it has been taken for granted by most that the city of Wuhan was the starting point of the Covid pandemic. While there has been much debate about where the virus came from—that is, whether it jumped to humans from an animal source at the Wuhan wet market or whether it leaked from the Wuhan Institute of Virology—few have questioned that a pandemic started in Wuhan.[2]
Science, however, is not about taking things for granted, but about questioning narratives and investigating facts. With this in mind, we wish to consider in more detail what happened in China in early 2020.
The City of Wuhan
The city of Wuhan with its population of more than 11 million people is about 20% larger than New York City (NYC), the largest city in the US. It is the capital city of the Chinese province of Hubei, and is considered one of the nine most important cities in China.[3] On 23 January 2020, this enormous city was “placed under lockdown due to the 2019 Novel Coronavirus outbreak.”[4] Hubei and other provinces in China followed suit soon after, albeit with different levels of restrictions.[5, 6]
Locking down a province of 58 million people for just 17 deaths in 24 days is certainly an extreme response.
During the 24 days between 31 December 2019 (when something “unknown” was first picked up) and 23 January 2020 (when Wuhan was “locked down”), the total number of cases of Covid in the entire province of Hubei was 444. The number of deaths attributed to Covid during this same 24-day period was seventeen.[JHU CSSE COVID-19 Data,7] Although some people question the validity of Covid data emanating out of China, it is important to note that the WHO accepted the data as reliable, and their decisions were based on it.
It is helpful to put this number of deaths into perspective. The crude mortality rate of Hubei is about 5.9 per 1,000 residents,[8] and the population of Hubei is 58 million. Thus, on average, 22,500 people in Hubei die during a normal 24-day period. The 17 Covid deaths, therefore, were effectively negligible. Locking down a province of 58 million people for just 17 deaths in 24 days is certainly an extreme response.
Was there something particularly lethal about Covid that warranted it? Based on the number of reported cases (444) and deaths (17), the case fatality rate (CFR) of Covid in Hubei province as of 23 January 2020 was 3.8%. For all of China it was 2.6% (17 deaths, 643 cases). Although this is higher than that for influenza A, it is four times less than the CFR of SARS, thirteen times less than that for MERS, and there are several dozen other human infectious diseases with a CFR greater than 2.6%.[9] Also, and more importantly, the CFR for any “unknown” disease will almost certainly appear much higher than it actually is until more information becomes available. Indeed, only one week later (1 February 2020), the CFR had already dropped to 0.7%,[10] and was showing signs of being on par with the flu.
Two days after the city of Wuhan was locked down, the Chinese New Year was ushered in (25 January 2020). This day is an important holiday in China. It usually involves many days of festivities and of increased travelling, making it “the world’s largest annual migration.”[11] Since the surge in travel volumes usually begins two weeks before the New Year, it had been ongoing for some time before the lockdown was initiated. According to Fan et al., “Due to the impending Chinese New Year, more than five million people travelled from Wuhan for either family reunions and/or holidays, contributing to the subsequent outbreak of Covid-19 in every province/region in China within a matter of weeks.”[12] The notion of locking down a province to stop the spread of a virus after five million people had already left the province, and would shortly return, makes this response even more odd.
Covid Cases in China
How bad was the “outbreak” of Covid that was purported to have been caused by this mass migration? To answer this question, we plotted Covid cases in China by province from January to March 2020. As case numbers were so small in most provinces, we show only the four provinces with the highest numbers of cases. The remaining 29 provincial regions (Taiwan is excluded) are lumped together and treated as a single entity.
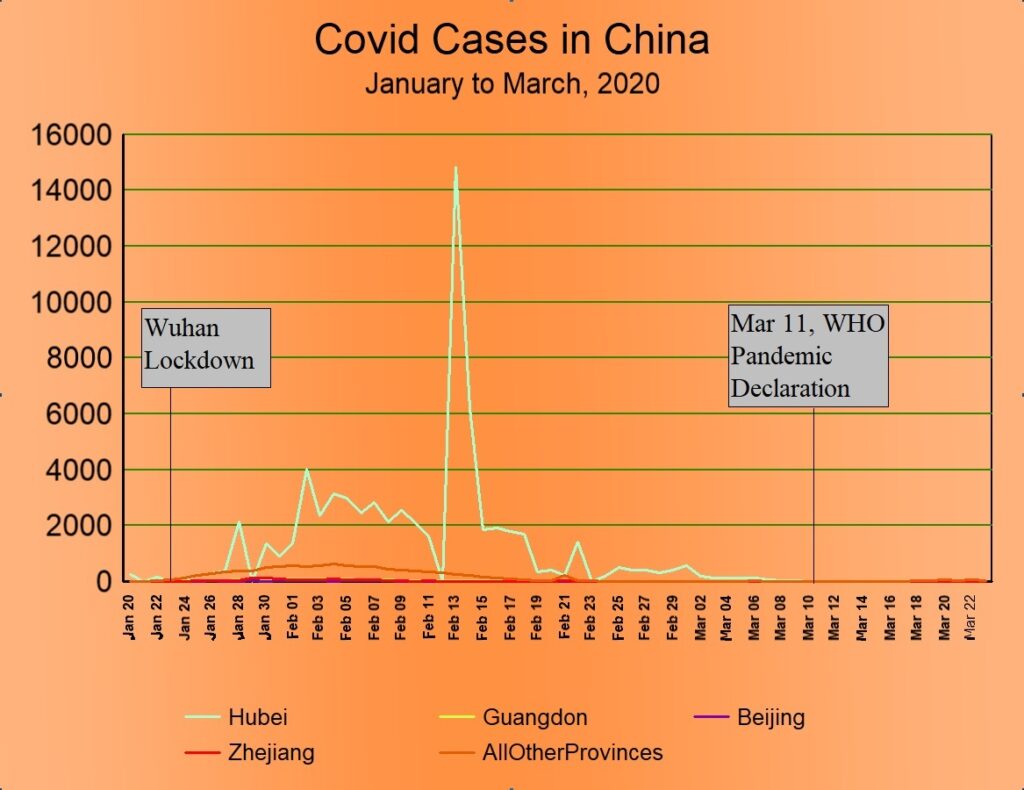
Several aspects of the preceding graph are worth noting. In the first place, the number of cases in Wuhan dwarfed all other provinces combined. Total cases in Hubei by the end of March amounted to 67,800, whereas the combined total in the other 32 provincial areas was only 13,639. Therefore, despite the exodus of five million people out of Wuhan in the days leading up to the lockdown, despite there being cases in every other province, and despite the other provinces not being locked down as tightly as Hubei province was, somehow the SARS-CoV-2 virus didn’t seem to spread in those provinces. Nor can the difference be attributed to population density, as 14 of the 33 provincial regions are more densely populated than Hubei.
Second, the spike in cases that occurred in Hubei province on 13 February 2020 is somewhat misleading. The increase resulted because China changed its policy and began including not only lab-confirmed cases but clinically diagnosed cases as well.[13] This policy change was in place for about two weeks and, in consequence, artificially inflated the number of cases by about ten thousand. Covid, after all, is clinically indistinct from other common respiratory viruses.[14]
Third, the total number of cases in China in the first three months was 81,439. Given that China has a population of 1.5 billion, it is observed that during these three months less than 0.006% of the populace was infected. Such a low number of infections argues strongly against the common claim that Covid is a “highly contagious disease.”[15] This is especially so given the fact that this almost negligible infection rate happened in the context of a mass migration and millions of family gatherings.
Fourth, the lockdown of Wuhan and the restrictions placed on the rest of China seem to have had no impact whatsoever on the trajectory of Covid cases. Cases began to rise after the lockdown was initiated, continued along a generally increasing trend for three weeks thereafter, and then tapered off to zero. By the time the WHO declared Covid a pandemic, it had entirely fizzled out in China.
Multiple published studies have claimed that the lockdown of Wuhan successfully eradicated Covid from the province. To justify the claim, the authors typically assume a three-week lag, thereby making the drop in cases artificially align with when the lockdown supposedly began to take effect.[16, 12] However, the papers we looked at have no more proven that the lockdown caused the decline than that the Chinese New Year caused it, for the timing of that event is also about three weeks before cases peaked. Furthermore, multiple studies into the usefulness of lockdowns in other countries concluded that lockdowns did not change the trajectory of Covid.[17, 18, 19] Figure 1 above is a powerful visual demonstration of this.
Covid Deaths in China
Having considered Covid cases, we turn next to examine the number of deaths attributed to Covid in China. Figure 2 below plots daily Covid deaths in the first three months of 2020. We have used the same provincial strategy as was used above (Figure 1) in the plot of Covid cases.
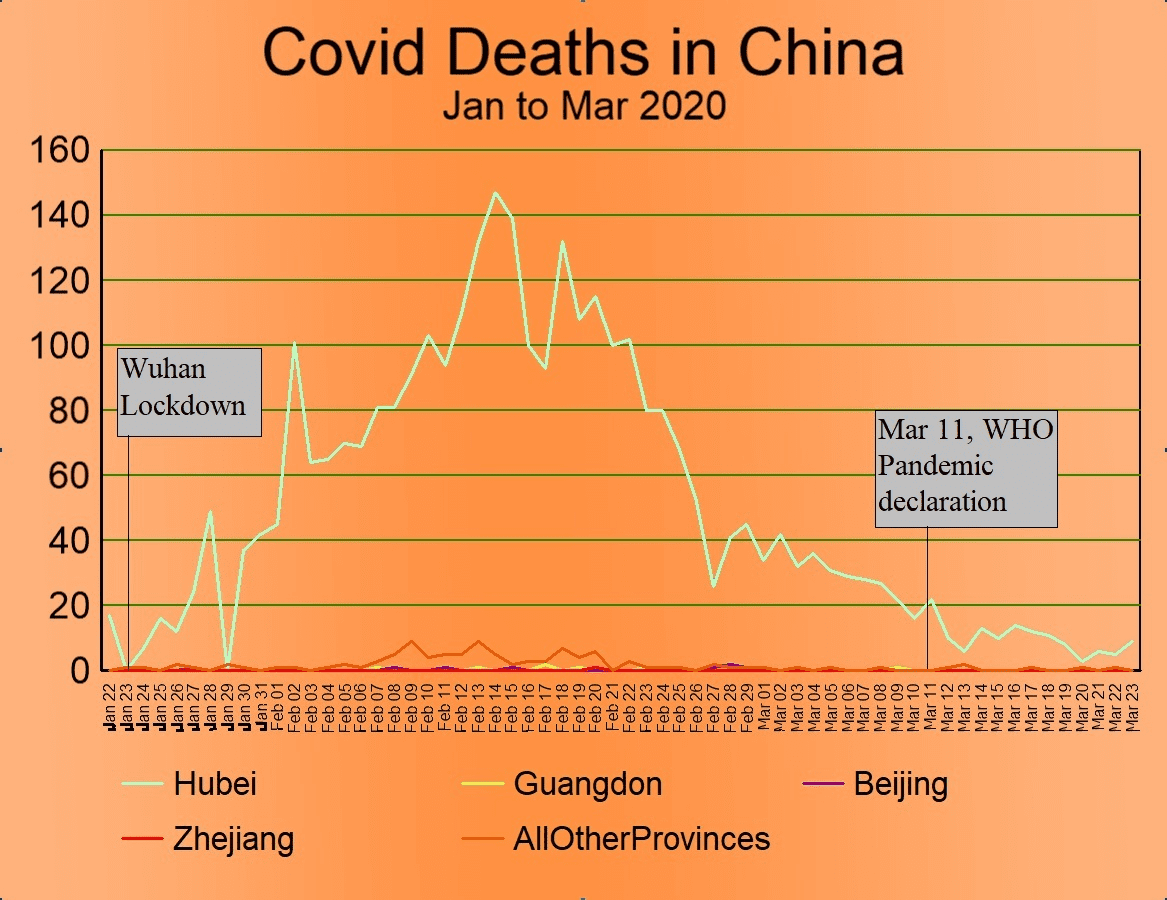
Once again, several notable observations can be made from this graph. First, the lockdown of Hubei province was initiated when daily deaths were almost zero.
Second, as with cases, the lockdown seems to have had no impact whatsoever on the trajectory of Covid deaths. Deaths generally rise for three weeks after the lockdown, peak on 14 February 2020 (one day after the peak of cases), and then taper off to zero over the next six weeks. By the time the WHO declared Covid a pandemic, deaths attributed to Covid in China were trending rapidly to zero.
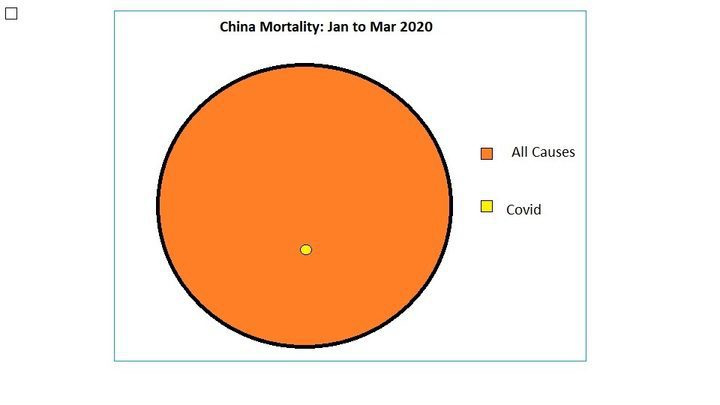
Third, the total number of deaths (3,285) and the peak (152) are extraordinarily small numbers when placed in the context of the enormous Chinese population. By way of comparison, in a typical three-month period, 2.48 million people in China die.[20] We compare these two numbers visually in the following diagram. (See Figure 3).
Conclusion
Having examined the data regarding Covid cases and deaths in China in the first three months of 2020, we observed that the lockdown of Hubei province was followed by a very slight surge in Covid cases and deaths. Both had fizzled out by the time the WHO declared a pandemic. In consideration of these facts, we find:
- no evidence that the Chinese lockdown had any impact on the trajectory of either Covid cases or deaths.
- no evidence that SARS-CoV-2 was highly transmissible.
- no evidence that Covid was unusually lethal.
- no evidence that anything significant happened in China as a result of Covid (other than the lockdown itself).
- nothing that can support the WHO’s decision to consider Covid a pandemic.
Unless the SARS-CoV-2 virus somehow changed its virulence depending on either ethnicity or regional boundaries,[21] we find no reason to think that Covid should have been more lethal in any other country than it was in China. As such, we conclude that there was nothing worthy of being called a pandemic in 2020. Finally, since Covid did not spread out of Wuhan despite five million travellers to other Chinese provinces (a “super-spreader” event of epic proportions), we find no reason to think that it spread out of Wuhan to other countries either.
References
- Anonymous, “Timeline: WHO’s COVID-19 response,” WHO, 2024, https://www.who.int/emergencies/diseases/novel-coronavirus-2019/interactive-timeline#!
- Ruiz-Medina BE, Varela-Ramirez A, Kirken RA, Robles-Escajeda E. “The SARS-CoV-2 origin dilemma: Zoonotic transfer or laboratory leak?” Bioessays. 2022 Jan;44(1):e2100189. doi: 10.1002/bies.202100189. Epub 2021 Nov 22. PMID: 34812505; PMCID: PMC8688222.
- Anonymous, “National Central City,” 2024, https://en.wikipedia.org/wiki/National_central_city
- Anonymous, “CDC Museum COVID-19 Timeline,” 2024, WHO, https://www.cdc.gov/museum/timeline/covid19.html#Early-2020
- He Z, Lv Y, Zheng S, Pu Y, Lin Q, Zhou H, Dong M, Wang J, Fan J, Ye Y, Chen H, Qian R, Jin J, Chen Y, Chen G, He G, Cheng S, Hu J, Xiao J, Ma W, Su X, Liu T. “Association of COVID-19 Lockdown With Gestational Diabetes Mellitus.” Front Endocrinol (Lausanne). 2022 Mar 30;13:824245. doi: 10.3389/fendo.2022.824245. PMID: 35432191; PMCID: PMC9005639.
- Ren X, Huang W, Pan H, Huang T, Wang X, Ma Y. “Mental Health During the Covid-19 Outbreak in China: a Meta-Analysis.” Psychiatr Q. 2020 Dec;91(4):1033-1045. doi: 10.1007/s11126-020-09796-5. PMID: 32642822; PMCID: PMC7343383.
- Dong E, Du H, Gardner L. “An interactive web-based dashboard to track COVID-19 in real time. Lancet Inf Dis. 20(5):533-534. doi: 10.1016/S1473-3099(20)30120-1
- Cheng L, Tan L, Zhang L, Wei S, Liu L, Long L, Zhang J, Wu Y, Zhang Q, Nie S. “Chronic disease mortality in rural and urban residents in Hubei Province, China, 2008-2010.” BMC Public Health. 2013 Aug 2;13:713. doi: 10.1186/1471-2458-13-713. PMID: 23915378; PMCID: PMC3751110.
- Anonymous, “List of human disease case fatality rates,” 2024, Wikipedia, https://en.wikipedia.org/wiki/List_of_human_disease_case_fatality_rates
- Anonymous, “Report of the WHO-China Joint Mission on Coronavirus Disease 2019 (COVID-19),” 2020, WHO, https://www.who.int/docs/default-source/coronaviruse/who-china-joint-mission-on-covid-19-final-report.pdf. Figure 4, p 13.
- Bristow, Michael, “China’s holiday rush begins early,” 2009, BBC, http://news.bbc.co.uk/2/hi/asia-pacific/7813267.stm
- Fan J, Hambly BD, Bao S. The Epidemiology of COVID-19 in the Gansu and Jinlin Provinces, China. Front Public Health. 2020 Sep 11;8:555550. doi: 10.3389/fpubh.2020.555550. PMID: 33042952; PMCID: PMC7517784.
- Leung K, Wu JT, Liu D, Leung GM. “First-wave COVID-19 transmissibility and severity in China outside Hubei after control measures, and second-wave scenario planning: a modelling impact assessment.” Lancet. 2020 Apr 25;395(10233):1382-1393. doi: 10.1016/S0140-6736(20)30746-7. Epub 2020 Apr 8. PMID: 32277878; PMCID: PMC7195331. See Figure 1.
- Anonymous, “Symptoms of COVID-19,” 2024, CDC, https://www.cdc.gov/coronavirus/2019-ncov/symptoms-testing/symptoms.html
- Huang Y, Wu Q, Wang P, Xu Y, Wang L, Zhao Y, Yao D, Xu Y, Lv Q, Xu S. “Measures Undertaken in China to Avoid COVID-19 Infection: Internet-Based, Cross-Sectional Survey Study.” J Med Internet Res. 2020 May 12;22(5):e18718. doi: 10.2196/18718. PMID: 32396516; PMCID: PMC7219722.
- Molefi M, Tlhakanelo JT, Phologolo T, Hamda SG, Masupe T, Tsima B, Setlhare V, Mashalla Y, Wiebe DJ. “The Impact of China’s Lockdown Policy on the Incidence of COVID-19: An Interrupted Time Series Analysis.” Biomed Res Int. 2021 Oct 28;2021:9498029. doi: 10.1155/2021/9498029. PMID: 34722775; PMCID: PMC8553467.
- Allen, Douglas W., “Covid Lockdown Cost/Benefits: A Critical Assessment of the Literature,” 2021, SFU, https://www.sfu.ca/~allen/LockdownReport.pdf?
- Eran Bendavid, Christopher Oh, Jay Bhattacharya, John P. A. Ioannidis, “Assessing mandatory stay-at-home and business closure effects on the spread of COVID-19,” 2021, European Journal of Clinical Investigation, https://onlinelibrary.wiley.com/doi/full/10.1111/eci.13484
- Berry CR, Fowler A, Glazer T, Handel-Meyer S, MacMillen A. “Evaluating the effects of shelter-in-place policies during the COVID-19 pandemic.” Proc Natl Acad Sci U S A. 2021 Apr 13;118(15):e2019706118. doi: 10.1073/pnas.2019706118. PMID: 33766888; PMCID: PMC8053946
- Anonymous, “Crude Death Rate,” 2019, UN-Data, https://data.un.org/
- Khanijahani A, Iezadi S, Gholipour K, Azami-Aghdash S, Naghibi D. “A systematic review of racial/ethnic and socioeconomic disparities in COVID-19.” Int J Equity Health. 2021 Nov 24;20(1):248. doi: 10.1186/s12939-021-01582-4. PMID: 34819081; PMCID: PMC8611382.