The Human Development Report (HDR) is a regular publication by the United Nations Development Programme (UNDP) and, to cite Wikipedia, it has an “extensive influence on the development debate worldwide”. The HDR is usually published annually although no report was published in 2021. This means the 2022 HDR, titled “Uncertain times, unsettled lives: Shaping our future in a transforming world” [1], is the first such report with data from the pandemic era.
At the core of each HDR are statistics on the Human Development Index (HDI). The HDI is a composite index of GDP per capita, life expectancy and years of schooling. It is the most common measure of human development. UN bodies and other global actors use the HDI to classify the world into developed and less developed countries. Prior to the pandemic, the conventional understanding of development incorporated the three dimensions of income, education, and health. The choice of these indicators was heavily inspired by Amartya Sen’s capabilities approach that ultimately revolves around every individual’s freedom of choice. The richer, more educated and healthier we are, the more capable we are to choose the best life out of a myriad of options, according to our personal values and aspirations. This is the first plot in the report:

The executive summary begins with the words:
“We live in a world of worry. The ongoing Covid-19 pandemic, which has driven reversals in human development in almost every country and continues to spin off variants unpredictably.”
‘The pandemic’ has become a regular catchcry to excuse everything from mild inconveniences (like long waiting times on phone hotlines) to outright catastrophes (like a record number of malnourished children). Yet, in order to better understand what exactly went wrong and what can be done better in the future, it might be worth development professionals at the UNDP and elsewhere specifying what they mean by ‘the pandemic’. Narrowly defined, the pandemic refers to the global spread of SARS-CoV-2. Because the authors mention unpredictably emerging variants, the reader is led to believe that the report was written with this definition of the pandemic in mind. While it is conceptually possible for a new disease to lower global life expectancy, one of the indicators used for the HDI, even then we would still need to ask how the virus affected the other indicators, namely income and schooling?
The past few years have not been exceptional just because of the discovery of SARS-CoV-2. Something far more unprecedented happened: governments all over the world decided to ‘lock down’ entire societies. Businesses had to shut doors, leaving billions without work from one day to the next. People were confined to their homes and banned from visiting their loved ones. Many countries saw all cultural and social life take a sudden break. It is estimated that 1.6 billion children and young people were affected by school closures. [2]
On one of the few occasions that lockdowns are even mentioned in the HDR, it is noted immediately afterwards that they were “caused by the pandemic” (p. 196). Although lockdowns were a response to Covid, the role of human decision making was omitted from the discussion. Policies are always deliberate decisions of humans weighing costs against benefits, negotiating between winners and losers. Potential effects of lockdowns on human development had been clear from the beginning. In fact, the stated intention behind lockdowns and school closures had been to prevent deaths, thus directly affecting one of the HDI’s components, namely life expectancy, at the expense of its other two dimensions. There were concerns about the potential strains that widespread SARS-CoV-2 transmission would pose to education systems; in particular, the risk that schools could become short-staffed as a result of extended staff absences and deaths after teachers contracted SARS-CoV-2. Despite these concerns, arguably it was not SARS-CoV-2 transmission but policy choices that had the greater impact on schooling.
Similarly, it may seem obvious that lockdowns had a negative effect on GDP, yet in 2020 some argued that stricter lockdowns actually benefited the economy [3]. This reasoning had some fundamental flaws. It generally rested on visions of complete eradication of the disease (Zero Covid), which only island states with closed borders such as Australia and New Zealand briefly seemed to approach. Even if eradication in humans had proven feasible, the virus would have remained in animal reservoirs.
The economic case for lockdowns usually incorporates the devastating short-term effects lockdowns have on big parts of the economy. Yet, lockdown proponents argued that by locking down harder and longer, future lockdowns could be prevented. This completely negates human agency. The UNDP was not alone in this misattribution. In 2020 and 2021, almost every media outlet published articles about countries being ‘forced’ into yet another lockdown, as if nobody had any choice. There is no natural law that forces shops and schools to close or prevents people from leaving their homes. Countries like Sweden and Nicaragua successfully proved that the only alternative to lockdowns was not societal collapse.
Economic activity could have taken a hit if the virus had killed or, even temporarily, disabled significant parts of the workforce above what happens in a normal year. Indeed, SARS-CoV-2 contributed to the death of some working-age people, but all in all, the virus primarily killed sick or retired people who were contributing little to GDP. Seroprevalence studies in people without prior infection or vaccination suggest an infection fatality rate (IFR) of 0.034% for 0- to 59-year-olds and 0.506% for 60-69-year olds. These numbers include sick people unable to work. Lockdowns, on the other hand, immediately affected economic activity, often by explicitly banning it. The plunge of the world economy in 2020 points to the significant economic impact of lockdowns, as opposed to the pandemic. The recovery of global GDP in 2021 as restrictions were gradually lifted in most countries adds further evidence to this. The advent of vaccines played a role in the economic recovery, by shifting the social consensus away from lockdowns and towards reopening free markets.
What would have happened if Covid-19 had been treated like every other previous disease? The overall effect of lockdowns and other pandemic-related restrictions is still very contested in scientific debate. We might have seen some more deaths from Covid-19 in a shorter time if there had been no interventions whatsoever. On the other hand, we might have seen fewer deaths from other causes, as there is mounting evidence that some of these were caused by lockdowns and other interventions [4]. Possibly, people would have voluntarily shut their businesses and taken their children out of school. This did not happen on a large scale anywhere, though, as most people did not have this choice.
In the following section, I shall analyse how the three HDI components were affected in different countries and how they influenced one another. I shall try to dissect as much as possible to what degree regresses in human development were indeed due to the spread of the virus and the burden of associated disease and death, and to what degree they were the result of policy choices.
Life expectancy
Life expectancy at birth is defined as the number of years a newborn could expect to live should prevailing patterns of age-specific mortality rates at the time of birth stay the same throughout their life. During the Covid-era, total mortality increased, thus life expectancy fell. Unless stated differently, all data on life expectancy and mortality here are my own calculations based on estimates from the UN Department of Economic and Social Affairs’ Population Division [5]. The figure below shows global life expectancy from 1950 to 2021. The drop during the past two years is only exceeded by China’s famine during the Great Leap Forward in 1960. Of course, it should not be ignored that the recent drop in life expectancy occurred after decades of steady growth. Life expectancy for a baby born in 2021 was 71 years – higher than for any year prior to 2013.

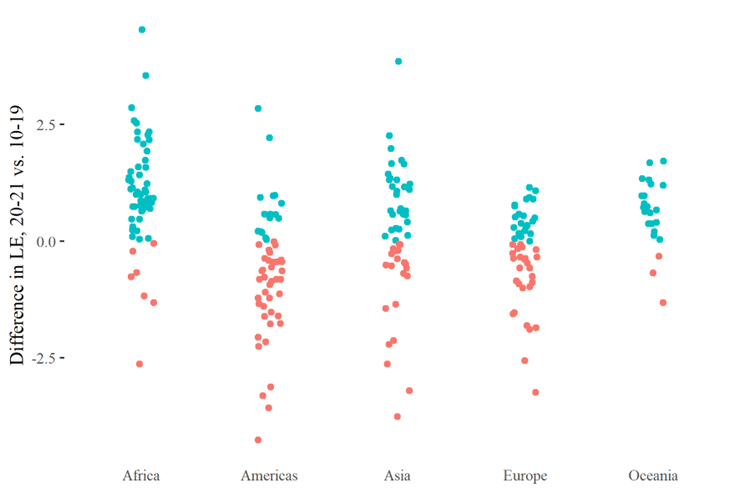
Despite the global spread of the virus, mortality trends differed enormously between countries. See here the difference between the average of 2020 and 2021 life expectancy as compared to the average of the five previous years (2015 to 2019) for 236 countries and territories:

We see that life expectancy even increased in a number of countries on every continent. The share of countries with increases in life expectancy was especially high in Africa and Oceania. Australia is the country with the fourth highest increase in life expectancy in 2020 and 2021 compared with the period 2015 to 2019 (1.38 years). Having no land borders allowed Australia to execute some of the world’s strictest travel bans and quarantine measures. While these rules certainly caused extreme hardship for many, it seems they enabled Australia to successfully suppress several Covid outbreaks in 2020 and 2021.
There is no global data for 2022 but it is nonetheless clear from more recent reports[6] that Australia did not maintain their track record. The country saw periods of high excess mortality in 2022. It is not sensible to read too much into short-term fluctuations in mortality, however. Some variation is normal and years of extraordinarily low excess mortality can be followed by years of extraordinarily high excess mortality. This has been called the ‘dry tinder effect’, such as in the discussion about Swedish excess mortality in 2020[7]. When one or two flu seasons have been very mild, there are more frail people left who will eventually die in the next more virulent flu season.
The three countries with even higher increases in life expectancy than Australia in the 2020 to 2021 period are two more island states, namely Palau (1.47 years) and Dominica (2.5 years); and Syria, which gained 3.8 years of life expectancy as the civil war cooled off somewhat. Given their levels of poverty and institutional constraints, it is hard to imagine that any of the countries that follow directly behind Australia, namely Togo, Sierra Leone, Mongolia and Lesotho, successfully suppressed Covid outbreaks with policy measures.
A major explanation for why life expectancy has not fallen as much in Africa is calculational. Life expectancy rose fastest in Africa in the recent past. In the chart above, I compared the 2020/21 average with the period 2015 to 2019. The chart looks very different by expanding the period of comparison to ten years (2010 to 2019):
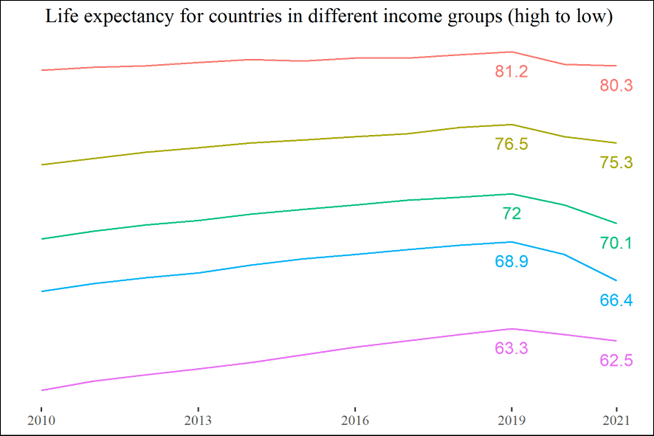
On the other end of the spectrum, life expectancy decreased by more than three years in Lebanon, Saint Vincent and the Grenadines, Andorra, and Bolivia, and by more than four years in Ecuador (-4.05), Mexico (-4.13), Azerbaijan (-4.17), and Oman (-4.25). Looking at how life expectancy dropped for countries with different income levels, we see that the decrease was lowest for low-income countries and high-income countries, whereas lower middle-income countries were hit hardest.
Both the best and worst cases are unevenly distributed across all continents, income levels, and political systems. There is also no obvious relationship between stricter pandemic policies and either higher or lower mortality. In the list of countries that saw an increase in life expectancy, we find countries notorious for their strict lockdowns, such as China and Australia, alongside countries that had no lockdowns, like Sweden and Tanzania.
The most common measurement of lockdown strictness is the OxCGRT lockdown stringency index[8]. It is calculated based on the largest dataset of non-pharmaceutical interventions collected by a team of hundreds of volunteers around the world under the leadership of the University of Oxford. The stringency index takes into account school closures, workplace closures, the cancellation of public events, closures of public transport, stay-at-home policies, restrictions on internal movement, international travel controls, and public information campaigns.
Below you can find two scatter plots of countries and territories where the x-axis indicates the OxCGRT lockdown stringency index and the y-axis shows the difference between the average life expectancy during 2020 and 2021, and the average of the five prior years. The left-hand graph depicts the mean stringency index throughout 2020 and 2021, while the right-hand graph depicts the maximum for each location.
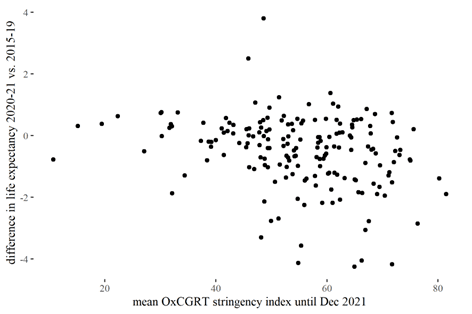
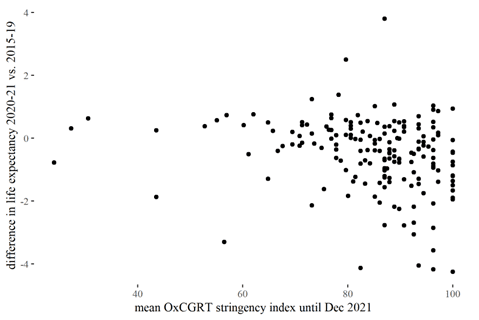
As illustrated, there is no clear correlation between stricter lockdowns and higher or lower mortality, at least if other factors are not taken into consideration. Note that, while there is no clear-cut global trend that more restrictive countries experienced lower mortality rates, this is no evidence that each and every restriction had no effect. A growing body of literature is analysing which pandemic policies proved successful and which did not, and we are still far from anything resembling a consensus. Several researchers have argued that mortality would have been higher without any intervention. The bulk of such studies only focuses on a relatively short time in spring 2020, and often rests on unproven assumptions like no voluntary behavioural changes (as is the case in the most-cited Flaxman et al. (2020). It is also problematic that most studies that claim lockdowns worked as intended only look at effects on either Covid cases or deaths attributed to Covid. Both numbers are themselves influenced by policy, namely the extent of testing. Bjornskov (2021) found no relationship between lockdown stringency and all-cause mortality in the first half of 2020. In a meta-analysis of 22 studies of the effects of lockdown stringency on Covid-19 mortality, Herby et al. found the average lockdown in Europe and the United States decreased Covid mortality in early 2020 by a mere 3.2 per cent. Even if policy interventions might have had a small initial effect in suppressing the virus, there is little evidence that this effect lasted beyond 2020, or that it outweighed the increase in non-Covid mortality associated with some of these interventions
That there are no clearer patterns in the absolute differences in life expectancy over the years does not mean that the poorest and the richest countries suffered the same absolute burden of deaths. Remember that life expectancy at birth is a hypothetical value. A baby born in a given year would live an average of x years if age-specific mortality rates were to remain constant. It is a statistic constructed out of real data, but from the hypothetical perspective of a newborn. If we look at what actually happened during the pandemic, it is important to keep the current age structure of populations in mind. Poorer countries generally have much younger populations. The risk of dying from a Covid-19 infection skews heavily towards the elderly (and some other, smaller risk groups). In developed countries, the median age of Covid deaths is normally well over 80 years. In developing countries, with poorly equipped health systems and a lower baseline life expectancy, the average age of Covid deaths can be assumed to be lower. Young people should still have been generally safe, and they constituted the majority of these populations.
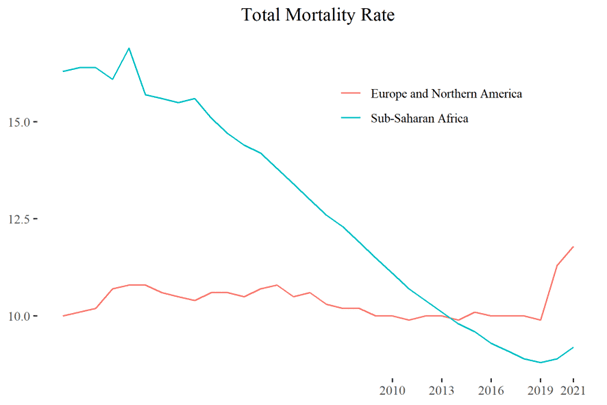
This is illustrated by comparing Sub-Saharan Africa with Europe and North America. The median age in Sub-Saharan Africa is 18 years and only three percent of the population are 65 or older. The different age structure is likely the main reason why Sub-Saharan Africa saw a much smaller uptick in mortality during the pandemic than Europe and North America.

As can be seen in the above plot, neither the virus nor lockdowns and school closures have, so far, slowed down the decline of under-five mortality in the world’s poorest countries according to official estimates. While it is no news that the virus is generally harmless for young children, school closures have reportedly harmed children in many ways, from increased malnutrition because of missing school meals[9] to increased numbers of teenage pregnancies[10]. Due to reallocation of resources to Covid-19 patients (real or anticipated ones), regular health check-ups were cancelled all over the world, surgeries were postponed, and millions of children missed out on routine vaccinations[11]. All this calls into question how tenable the mortality estimates are. For many countries, official death counts are not yet available for 2021. Some statistics put into question the decrease in child mortality in the world’s poorest nations. In the 2022 World Malaria Report, the WHO estimates that in both 2020 and 2021, 40,000 more African children under 5 years of age died from Malaria than what was the average for the five previous years[12]. UNICEF estimates that in 2020 alone, over 200,000 South Asian children under five years died due to crucial health and nutrition services being halted. Even if child mortality was not affected immediately in 2020, the disturbance in regular health care and the socioeconomic fallout from the restrictions risk increasing mortality rates for years to come.
We want to slowly move our focus to the other two components of the HDI. What is the relationship between life expectancy, average years of schooling, and GDP per capita? Non-economists may take offence at the implicit, unintended value judgement in these words but, in terms of GDP, there are net contributors and net recipients. GDP is by no means a perfect measurement for societal wellbeing, of course. Elderly people often provide unpaid care work, but also often require such. Generally speaking, the age group contributing most to economic activity is the ‘working-age population’, although this term has to be interpreted for different local settings. The elderly are usually net receivers.
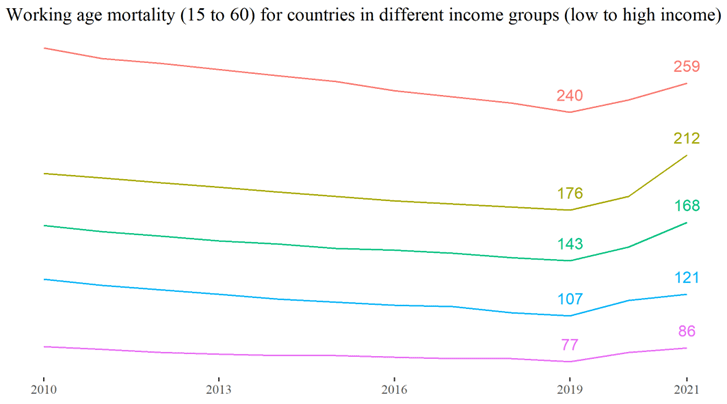
Detailed mortality data by age groups is available for many European countries at EuroMOMO[13]. According to this data, there has been no excess mortality in any country for under 15-year-olds. For the age bracket 15 to 44 years, there have been no substantial increases either on average, albeit very briefly in a few countries. For the age group 45 to 64 years, excess mortality also remained flat in many countries, but showed marked increases in others. Yet only three countries saw a larger spike in excess mortality than that faced by Germany in 2018. At that time, hardly anyone outside the health sector noticed the spike and it clearly did not cause economic and societal havoc. Of 20 countries for which data is available, 17 did not see this upper working age mortality peak higher than in 2018 in Germany.

On the aggregated European level, significant excess mortality is notable among the 45 to 65-year-olds, eclipsing any prior peak between 2017 and 2019. But few countries faced increases in working age mortality that went far beyond pre-pandemic fluctuations. Here is a graph illustrating mortality of 45 to 64-year-olds in the 23 participating countries and states.

Unfortunately, earlier data is not available. All in all, the data from EuroMOMO suggests that peaks in working-age mortality affected only a few countries during the declared pandemic and, where they did, they were not much higher than in earlier flu seasons. Note that while 15 to 64-year-olds can reasonably be classified as ‘working-age population’ in many places, the lower threshold would realistically be a few years older in countries with high levels of formal education, where most young people do not enter the labour market before their 20s. More crucially in this context, a large share of 15 to 64-year-olds who died of Covid-19 were not in the workforce. While there were certainly cases of premature death in healthy (or undiagnosed) young adults, they were rather rare. Often, people who died with Covid-19 at a younger age had severe health problems that would have already kept them out of the workforce.
In the UN population data, the closest comparable age bracket is 15 to 60. Working-age mortality did indeed spike on the aggregate level, mostly in lower middle-income countries. All in all, we can postulate that 2020 and 2021 were certainly bad years in terms of older working-age mortality, but that only a few countries, if any, saw increases in working-age mortality sufficient to create economic turmoil. In the context of GDP per capita, Covid-19 could actually (and perhaps cynically) have had a positive effect, as it killed predominantly the sick and elderly, i.e. net receivers. While we have not experienced mass death and disability among the workforce in Europe, the younger age structure of some of the poorest developing countries ruled out this scenario from the beginning.
Everything discussed in regard to workforce mortality also affects school teachers. Schooling could have been disrupted to some extent by teachers falling ill. Yet, there is no evidence to suggest that this effect would have come anywhere close to the effect of deliberate school closures.
Schooling
Two indicators related to education feed into the HDI: mean years of schooling received by people aged 25 and older, and expected years of schooling. The first does not change meaningfully within two years. Expected years of schooling have likely been decreased by school closures, however. The indicator is defined as the “number of years of schooling that a child of school entrance age can expect to receive if prevailing patterns of age-specific enrolment rates persist throughout the child’s life”.
Years of schooling is not an end in itself; it is merely a proxy for education. Concepts of education differ between societies and evolve over time. For millennia, children have grown into capable adults without formal schooling systems. Even assuming that knowledge could be represented by a number, schools differ in the quality of knowledge delivered. Schools can arguably even do a lot of harm, be it by indoctrinating children into totalitarian ideologies or by exposing them to the violence of bullies or teachers.
Nonetheless, for a long time before the recently declared pandemic, it had been the general consensus among development scholars and the wider society that schooling is so closely associated with positive outcomes later in life that more children going to school for more years is a strong indicator of a positive human development. There are good reasons for this: more years of schooling have regularly been shown to be positively correlated with a higher income, on both individual and societal levels[14].
Access to quality education is highly unequal. Even in the richest countries, education is often inheritable, with children of wealthier, more educated people being significantly more likely to attain high levels of formal education. Much evidence points to school closures contributing to a widening of the education gap. A 2022 World Bank review of studies of the effects of school closures noted that most studies found evidence of learning loss, and that levels of learning loss were consistently correlated with student socio-economic status. Being ‘homeschooled’ can provide better tuition than a formal school, but it can also result in students being left unsupervised and continuously skipping classes.
Even if cancelled school years can be caught up, effects on GDP will likely be negative as today’s students will enter the workforce later. The longer-term effects are yet to be observed. A higher income is correlated with a longer life, and a positive correlation between education and life expectancy is also well-established, as studies in the UK[15] and Germany[16] have shown. While it is too early to balance accounts, these studies point to the risk of school closures having negative effects on other dimensions of human development.
Unfortunately, the UNDP authors are surprisingly unclear about how school closures are incorporated into their HDI calculations. They mention a “Covid-19-Adjusted Human Development Index” that retains the standard HDI “but modifies the expected years of schooling indicator to reflect the effects of school closures”. However, they only use the adjusted HDI for some graphs but don’t mention it in the statistical annex. It is not clear why the calculation of such an adjusted index would even be necessary and why effects of school closures are not incorporated in the regular HDI.
As a source for the Covid-19-adjusted HDI, the authors merely name themselves, that is: Human Development Report Office. For the calculation of the regular HDI, they list three different sources for the expected years of schooling indicator. Both UNICEF’s Multiple Indicator Cluster Surveys and the USAID Demographic and Health Surveys feature data for a few countries only. Lastly, the CEDLAS Socio-Economic Database for Latin America features data on school enrolment rates for nine Latin American countries in 2020. In the age group 6 to 12 years, school enrolment decreased everywhere. Note that enrollment does not equal attendance. In the following, I use data from UNESCO’s Survey on National Education Responses to COVID-19 School Closures[17]. Categories of school closures were defined as follows:
| Closed due to COVID-19 | Government-mandated closures of educational institutions affecting most or all of the student population |
| Academic break | All instructional activities are suspended during this period. |
| Fully open | Schools are open and deliver classes exclusively face-to-face for most or all of the student population. |
| Partially open | various modalities co-exist where schools are: (a) open in certain regions ; and/or (b) open for some grades, levels, or age groups; and/or (c) open with reduced in-person class time, combined with distance learning (hybrid approach). |
The term ‘face-to-face’ should not be taken too literally here, as in many countries, students and teachers were forced to cover their faces in class. As with other policies, comparing the scope of school closures across different countries is hampered by the complexity of these measures and their variation. If schools in a country were ‘partially closed’ that could mean anything from upper secondary schools in a few Covid-19 hotspots operating with stretched-out schedules, to full closures in some parts of a country and few schools in low-incidence regions operating far from any normalcy. In other words, ‘partially closed’ is an umbrella term that would include both Sweden and China for much of 2020 and 2021. In addition to plain closures, several other policies severely interfered with normal school life. Teachers and students were mandated to quarantine, such as when a classmate or a family member tested positive. Teachers and students were forced to wear masks in class. School trips and field days were cancelled. Recording a few days of school closures thus does not mean that education was not severely disrupted by public health policies.
Only 12 countries never fully closed all schools: Australia, Burundi, Belarus, Iceland, Nicaragua, Nauru, Russia, Sweden, Tajikistan, Tokelau, Turkmenistan, and the United States. Only four countries never even partially closed their schools: Burundi, Belarus, Nauru, and Tajikistan. Several small island nations follow in the ranking with very few days of school closures, including Niue, Marshall Islands, and Tonga. In the table below, I selected only countries with a school-age population (pre-primary to upper secondary) of at least 500,000. We see that the numbers rise quickly, i.e. there are few countries with no or very short school closures. France is still in the top ten of larger countries in this regard, despite schools having been partially closed for over 2.5 months.
| Country with at least 500k school-age population | Days of school closures (full or partial) |
| Burundi | 0 |
| Belarus | 0 |
| Tajikistan | 0 |
| Turkmenistan | 30 |
| Papua New Guinea | 42 |
| Switzerland | 45 |
| Croatia | 70 |
| Japan | 80 |
| France | 82 |
| Uzbekistan | 82 |
The table below lists the countries with the longest school closures. As shown, schools were closed for almost two years in some countries.
| Country | Days of school closures in 2020 and -21 (only fully) | Country | Days of school closures in 2020 and -21 (partially or fully) |
| Uganda | 450 | Uganda | 612 |
| Bangladesh | 442 | India | 598 |
| Philippines | 438 | Panama | 587 |
| Kuwait | 431 | Ecuador | 576 |
| Venezuela | 424 | Argentina | 575 |
| Myanmar | 414 | Nepal | 574 |
| Honduras | 409 | Bolivia | 573 |
| Panama | 386 | Costa Rica | 572 |
| Mexico | 374 | Honduras | 566 |
| Iraq | 356 | Guatemala | 564 |
Even though Covid-19 has posed no bigger risk to children of school age than other common viral infections such as influenza (and a smaller risk than Malaria), schools were closed all over the globe in the name of protecting the elderly. When schools reopened, increases in absenteeism were reported as youths had become used to a life without school. Some had started to work, others married, and others had withdrawn from society altogether. This often had material reasons, such as children being forced to work in order to survive; but surely, there is a psychological dimension to this phenomenon as well. How can children still believe grown-ups when they speak of the importance of going to school, after the same grown-ups decided to close schools so suddenly and leave them closed for months?
The coming years will tell how long-lasting the detrimental effects of school closures on human development will be. As schooling itself is an indicator of human development according to the current understanding of the UNDP and other development players, school closures may be predicted to affect human development negatively as it is partly based on years at school. It is incumbent on institutions who claim to work for advances in human development to explain how they could have endorsed school closures during the Covid-19 pandemic.
Economy

Shown here is the growth rate of GDP per capita since 1960 according to World Bank data[19]. We see that the world economy contracted more in 2020 than it did during the great recession. Given that SARS-CoV-2 is most dangerous for people of old age or with severe comorbidities, it is far from clear whether the net effect of Covid on GDP per capita would have been negative in the absence of any policy interventions.
The median age of deaths attributed to Covid-19 was over 80 years in Germany[20] and the UK[21]. Over 80-year-olds do not usually contribute much to economic output anymore. From purely calculational logic, a disease that overwhelmingly kills retired persons should even have a positive effect on GDP per capita, as the share of people of working age increases. Therefore it is implausible that Covid caused the drop in GDP per capita.
Even though it is not clearly pointed out in the HDR, the sudden drop in economic activity is much more plausibly explained by lockdowns. What this term meant varied considerably between countries but it generally included an enforced halt to the activities of societies by policy interventions which went far beyond those sketched out in (pre-2020) pandemic plans. In no other pandemic in history have entire populations been forced to stay home for weeks and months, with many requested to work from home or not to work altogether. But such drastic interruptions of economic life happened in response to Covid-19 in societies all across the globe, irrespective of political systems.
To differing degrees, lockdowns were cushioned by financial compensations. Even where the entire workforce, or at least the registered part of it, were fully compensated by unemployment benefits, lockdowns have led to long-lasting market disturbances. Beyond the measurable economic consequences, a general loss of trust in the reliability of social contracts might have long-lasting adverse effects on individual entrepreneurship and motivation. Hundreds of millions of people experienced society suddenly deciding that their work was ‘inessential’. While the cultural, hospitality, and tourism sectors survived only by donations or increased public expenditure, consumer spending moved online. These sectors might have taken a hit without any government intervention, as some people might have applied social distancing behaviours without any political mandate or recommendation to do so. But it is hard to imagine that the economic damage of the pandemic would have been nearly as bad had it not been for lockdowns. As shown before, there is no clear relationship between lockdown stringency and mortality. Let us now consider how lockdown stringency related to income per capita in 2020 and 2021:
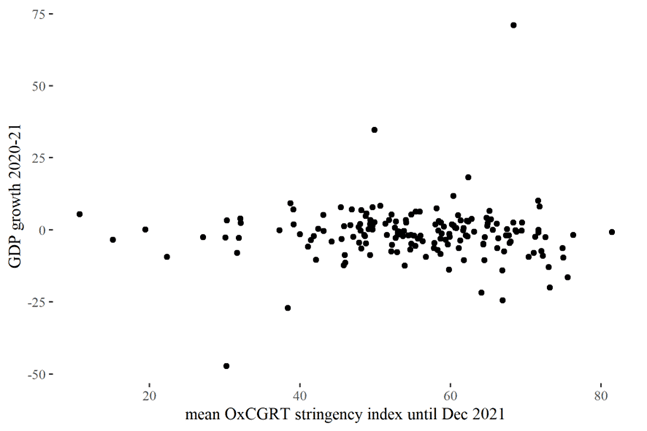
There is little correlation between lockdown stringency and GDP growth. This does not mean that lockdowns did no harm to economies. There are three reasons why this lack of correlation between lockdown stringency and economic performance is plausible: First, even the measures in many of the least strict countries were extraordinarily disruptive when compared to what had normally been seen before 2020. Second, the world had never been more interconnected than at the onset of the pandemic. Supply chain disruption and travel restrictions in other countries affected even the few countries that remained relatively open. Third, governments invested much in compensation payments to offset citizens for their lost income. The current inflation was likely caused to some extent by governments printing money to keep their citizens afloat while also preventing them from working.
Around 60% of economies shrank during 2020 and 2021. The outliers with the highest growth rates over the pandemic were Guyana (71% growth), Timor-Leste (35%) and Ireland (18%). In the case of the first two, the unusually high growth rates are due to oil exports, while Ireland benefited from the presence of international corporations who profited from the pandemic (e.g. Google, Meta, Pfizer). The biggest loss in GDP per capita was seen in Macau (-47%), possibly due to the closure of its gambling industry.
It is surprising how the HDR authors can write that “the response to the Covid-19 pandemic has also reminded us how people-centric policies can substantially enhance human wellbeing. As the pandemic’s economic, social and health impacts mounted, governments around the world deployed a flurry of expansive social protection measures to support people through the crisis.”. For the authors, it does not seem worth mentioning that the response to the Covid-19 pandemic created (or at least increased) the need for expanded social protection measures in the first place. It is astounding how UNDP staff see “new reference points for social protection and economic policy” in 2020/21 policies, given the horrific results we are looking at.
Unfortunately, the World Bank has not yet published data on income and wealth distribution within countries in 2020 and 2021. According to preliminary figures and estimations, the world saw an unprecedented wealth transfer from the poor to the rich in 2020 and 2021. Based on data from the World Bank, Forbes Magazine and Credit Suisse, Oxfam calculates that the ten richest men doubled their fortunes during the pandemic, while incomes of 99% of humanity fell[22]. The World Bank estimates that an additional 75 to 95 million people were living in extreme poverty in 2022 compared to pre-pandemic projections[23]. However, this estimate might well be an understatement as they rely on the assumption that “all households’ real incomes have grown in line with the country’s real GDP per capita”.
The observed increase in poverty will probably also translate into lost life years. Even in rich countries with universal health care access, individual income and life expectancy are correlated. This has been shown in many countries, such as Germany[24] and the UK[25]. At the same time, a lower income is associated with fewer years of schooling on average. All in all, the recession of 2020 may well have long-lasting negative effects on other dimensions of human development.
Two case studies
In the following section, I highlight some countries that stood out in their response to Covid-19. Sweden became infamous as the one that never locked down, chastised by lockdown proponents, idolised by lockdown sceptics. Yet the Scandinavian nation is actually no outlier in the most common measurement of lockdown strictness, the OxCGRT lockdown stringency index. Based on their maximum stringency indices, Sweden ranks as only the 15th most open of all territories compared, behind Iceland (12) and Latvia (13), and only a few places ahead of Finland (20) and Denmark (21). The non-island states with the lowest maximum lockdown stringency were Nicaragua, Burundi, Belarus, and Tanzania. Regarding mean lockdown stringency, Nicaragua, Tanzania and Burundi make up the top three, while Belarus ranks sixth. According to this measure, Sweden ranks 40th, behind all its Nordic neighbours (Denmark 31st, Norway 36th, Finland 34th). While the OxCGRT stringency index is the most comprehensive and most widely used index for lockdown strictness, no dataset is fully accurate and without mistakes.
Case Study 1: Nicaragua
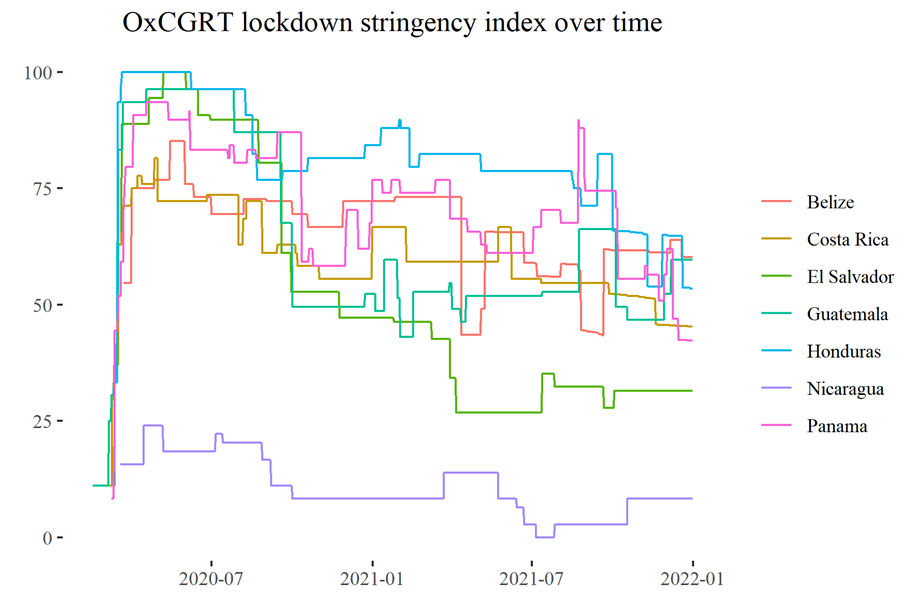
Both in terms of the maximum and mean of the OxCGRT stringency index, Nicaragua was the country with the least restrictive approach to the pandemic. The Nicaraguan case is particularly interesting because of the contrast with its neighbours. Sweden was surrounded by countries who were still amongst the least strict in the world. For example, there were never stay-at-home orders or outdoor mask mandates in any Nordic country, and Sweden was actually the only Nordic country to ban people from aspects of public life based on their vaccination status. Nicaragua, on the contrary, borders Honduras whose population was confined in their homes for months. Their Southern neighbour had no formal stay-at-home orders but banned all vehicle traffic, closed businesses, and had some of the longest school closures.
It should be noted that Nicaragua is much poorer than its southern neighbour with a nominal GDP per capita of $5,575 in purchasing power parity in 2019, as compared to $22,468 in Costa Rica, according to the World Bank. Honduras is comparable, however, at $5,851. As can be seen below, all Central American economies contracted in 2020. Throughout 2020 and 2021, Nicaragua had the highest GDP growth rate in the region (5.4%).
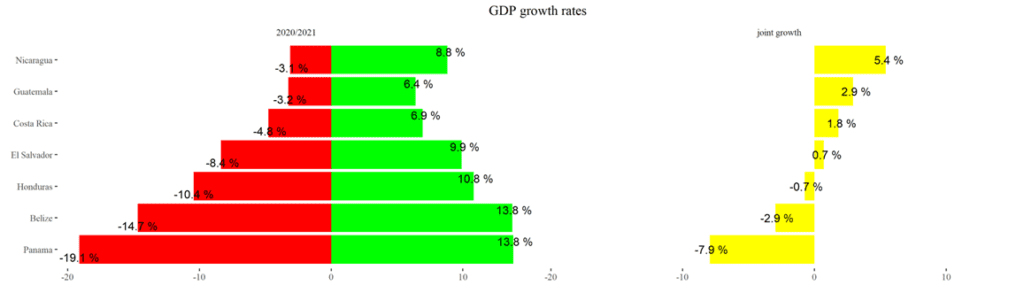
According to UNESCO data, schools were never fully closed in Nicaragua, but only partially closed for 105 days, most of these reportedly being private schools. In all other Central American countries, schools were fully closed due to Covid-19 for over 200 days, with Honduras leading with 409 days of full closure and 157 days of partial closure.
The reason why average life expectancy in Nicaragua decreased the least among Central American countries is that it quickly bounced back in 2021 while it continued falling in the other countries. To some extent, more rapid progress in human development could be due to some catch-up effect that might benefit poor Nicaragua over its richer neighbours. And of course, the good performance of Nicaragua may not only be ascribed to what they did not do (i.e. close schools and businesses), but what they did do[26]. The Sandinista government has invested heavily in the country’s health system in recent years. New hospitals have been built and 18 percent of the government budget was spent on health in 2020[27]. Based on this measure, Nicaragua ranks 15th out of 188 countries compared by WHO, yet three other Central American countries rank equal or higher.
| Country | HDI 2019 [27] | HDI 2021 | GDP p.c. (PPP) 2019 | GDP growth 2020+2021 | Days of school closures (fully/partly) | Mean life expectancy 2019 | Mean life expectancy 2020/21 minus prior 5/10 years | Health expenditure as % of total gov. expendit. 2020 |
| Belize | 0.716 | 0.683 | 9,410$ | -2.9% | 307/118 | 73.9 | -1.86/-1.6 | 13% |
| Costa Rica | 0.810 | 0.809 | 22,468$ | 1.8% | 303/269 | 79.4 | -1.23/-1.09 | 25% |
| El Salvador | 0.673 | 0.675 | 9,402$ | 0.7% | 320/239 | 72.6 | -1.36/-1.13 | 18% |
| Guatemala | 0.663 | 0.627 | 9,038$ | 2.9% | 229/335 | 73.1 | -2.08/-1.52 | 16% |
| Honduras | 0.634 | 0.621 | 5,851$ | -0.7% | 409/157 | 72.9 | -1.9/-1.4 | 12% |
| Nicaragua | 0.660 | 0.667 | 5,575$ | 5.4% | 0/105 | 74.1 | -0.78/-0.24 | 18% |
| Panama | 0.815 | 0.805 | 32,875$ | -7.9% | 386/201 | 77.8 | -1.29/-0.82 | 20% |
All in all, the example of Nicaragua challenges the narrative that lockdowns were a successful strategy. That Northern European countries had some of the lowest excess mortalities with some of the least restrictive measures is often attributed to them being among the richest, least densely populated societies on the planet. Finally, Nordic countries supposedly benefited from higher levels of trust in government and social coherence more broadly. None of this holds for Nicaragua, which is a country with even fewer restrictions than Sweden had. It is one of the poorest countries in its region and has only recently seen major outbreaks of political violence, but still managed to outperform all its neighbours in every aspect of human development.
Case Study 2: East Africa
There is another case study worth looking at: East Africa, with two more of the least restrictive countries, namely Tanzania and Burundi, located in the region. As a set of countries for comparison, I took the East African Community (EAC), excluding the Democratic Republic of Congo that only joined this association in 2022 and is not East African in geographical terms.
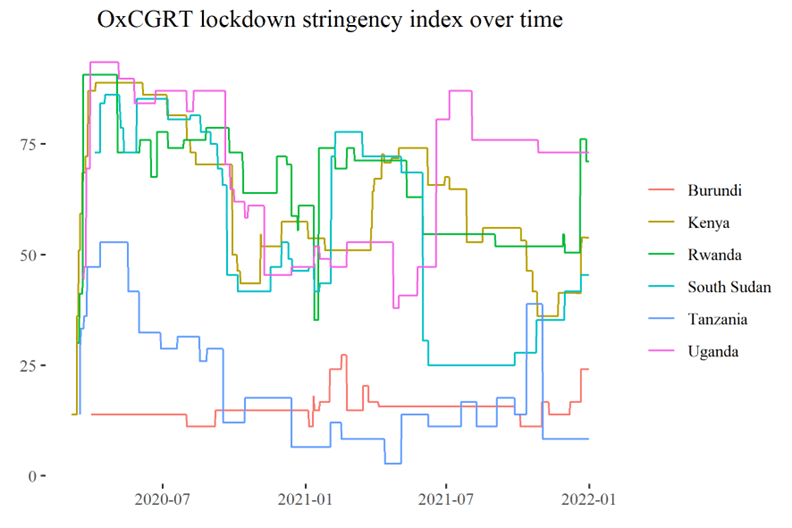
Here, Tanzania is the only country that saw an improvement in its HDI between 2019 and 2021. Burundi saw a decline, however. A small and poor country like Burundi relies heavily on imports and international assistance, with official development assistance as percent of GDP being 18 percent for Burundi in 2020 as compared to 4% in Tanzania[29]. It was therefore disproportionately affected by shocks to the world economy.
As all countries in the region started at a relatively low baseline, life expectancy did not decrease significantly compared to the ten previous years. Compared with the previous five years, it decreased only slightly in Kenya and South Sudan – the richest and poorest countries in the region. In terms of GDP per capita, Kenya and Rwanda grew most, despite relatively heavier restrictions.
| Country | HDI 2019 | HDI 2021 | GDP p.c. (PPP) 2019 | GDP growth 2020+2021 | Days of school closures (fully/partly) | Mean life expectancy 2019 | Mean life expectancy 2020/21 minus prior 5/10 years | Health expenditure as % of total gov. expendit. 2020 |
| Burundi | 0.433 | 0.426 | 760$ | -3.4% | 0/0 | 62.4 | 0.31/1.73 | 8% |
| Kenya | 0.601 | 0.575 | 4,795$ | 3.1% | 194/65 | 62.9 | -0.39/0.24 | 8% |
| Rwanda | 0.543 | 0.534 | 2,284$ | 2.2% | 221/139 | 66.4 | 0.53/1.58 | 9% |
| South Sudan | 0.433 | 0.385 | no data | no data | 231/147 | 57.3 | -0.41/-0.22 | 2% |
| Tanzania | 0.529 | 0.549 | 2,686$ | 0.2% | 74/28 | 67.0 | 0.7/2.34 | 9% |
| Uganda | 0.544 | 0.525 | 2,345$ | -0.2% | 450/162 | 63.0 | 0.38/2.34 | 3% |
An important limitation of data from OxCGRT or any other policy tracker is that there is no information about actual enforcement. Some countries had tough restrictions on paper but they were not widely enforced. The smaller and poorer a country is, the harder it is to find reliable information online. Available news reports are often limited to the capital cities. Finally, even where news reports describe executive actions to enforce lockdowns, like police checkpoints, it is mostly impossible to deduce how representative such actions are. Google’s data on mobility based on smartphone users gives some clues, and their mobility report[30] features data on how much mobility declined or increased compared to the months before the pandemic was declared.
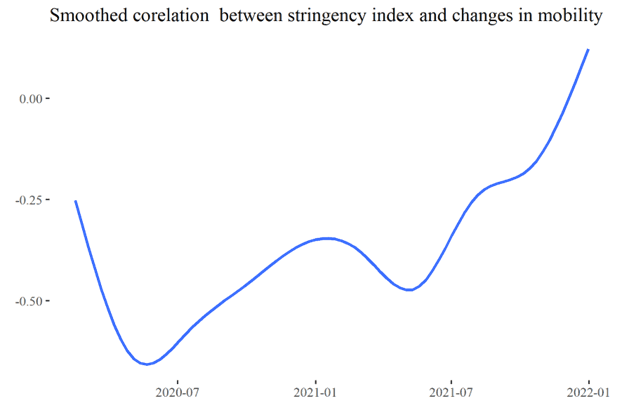
I checked whether a higher OxCGRT lockdown stringency index was associated with greater decreases in mobility. For this purpose, I took the mean of changes in mobility for different types of locations (e.g. workplaces, parks) per country and per day. Next, I calculated the correlation coefficient between this mean change in mobility and the stringency index separately for every day. The following figure shows a smoothed line plot of the correlation coefficient between stringency index and changes in mobility.
We see that there was indeed a strong negative correlation for a long time, especially during the first lockdown. We also see that the correlation decreased and vanished in recent months. A strong correlation of stringency index and mobility change during the first lockdown suggests that stricter rules were generally followed. The fact that the correlation wanes over time could be explained logically by two reasons: firstly, an increased weariness of populations to comply with pandemic restrictions; and secondly, that the stringency index is a composite measure of many non-pharmaceutical interventions, which do not universally aim at decreasing mobility. The importance of restrictions on individual mobility decreased over time, with stricter policies in 2021 often meaning stricter vaccine or mask requirements, not stay-at-home orders and the like. All in all, the negative correlation between the stringency index and mobility changes until late 2021 indicates that on average, stricter rules had also been followed.
Outlook and discussion
The indicators making up the HDI are sadly representative of broader setbacks in development. Similarly, the 2022 report on the 17 Sustainable Development Goals (SDGs) gives similarly little reason for optimism[31]. The global poverty rate is estimated to have risen from 8.3 to 9.2 percent between 2019 and 2020. An estimated 150 million people more suffered hunger in 2021 compared to 2019. Meanwhile, the global prevalence of anxiety and depression increased by an estimated 25 percent in 2020. While all of this has been explained by ‘the pandemic’, none of those statistics are the natural effect of a virus.
By the time this text was finished, it was already 2023. Therefore, I would like to end with a brief recapitulation of the past year. Unfortunately, not much global data on human development indicators is available for 2022 thus far. In many countries, 2022 marked the end of all pandemic restrictions. Countries like Uganda and the Philippines finally reopened their schools after two years of closures. Drawing on data from EuroMOMO, there was significant excess mortality throughout 2022 but the peaks were not as high as in 2020 and 2021.
Controversial discussions are ongoing regarding what might explain these unusually high rates of excess mortality. It remains to be seen whether a consensus will ever be reached regarding the influence of non-pharmaceutical interventions like lockdowns on total mortality. The same can be said regarding the vaccine rollout.
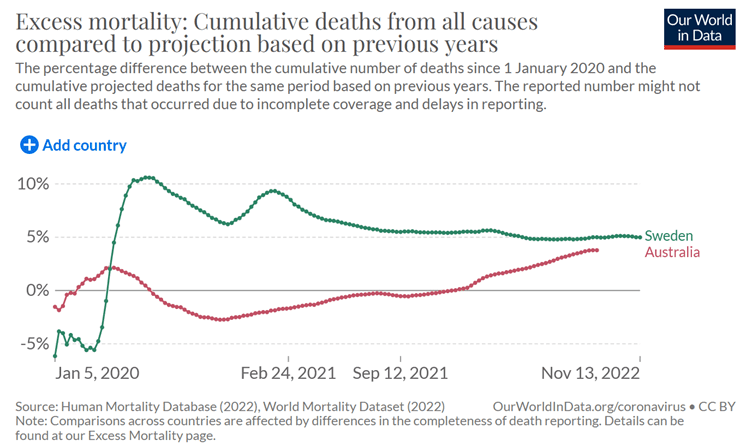
In 2022, the last strongholds of the ‘Zero Covid’ approach. It is only now that we can make sensible comparisons regarding which countries did better or worse in the pandemic. Sweden received a lot of bad press for its high excess mortality in 2020 but has performed very well in this metric ever since. Australia, on the other hand, was praised by supporters of lockdowns for its low Covid-19 mortality in 2020. If we look at cumulative excess mortality two years later, there is hardly any difference between both countries as the chart (above) from Our World in Data shows[32].
In 2022, GDP growth slowed down compared to 2021, but almost all countries saw real GDP growth in 2022. It is not clear if that holds when corrected for increased consumer prices, however. For many, inflation has been the dominant concern in the past year. A cost-of-living crisis increases the hardships poor people face globally.
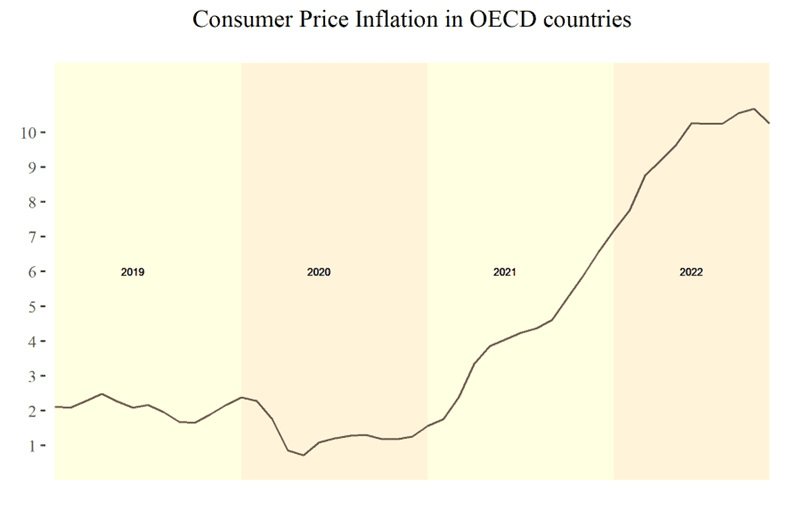
Many Western leaders and media sympathetic to them have blamed inflation on the Russian invasion of Ukraine. In publications like the HDR, the war is named as a major destabilising factor. It is certainly true that supply chain interruptions due to the war, as well as sanctions, and increased military spending, put additional pressure on prices, specifically of fossil fuels and grains, which are exported by the warring parties. It would be dishonest to put the blame for inflation mostly on the Ukraine War, though. A monthly Consumer Price Index is available for OECD countries and illustrated above. It clearly shows that inflation began to take off in the beginning of 2021 and skyrocketed in autumn 2021. In the most recent months, prices have stabilised again. If there is any truth to monetary theory, a main driver behind the recent inflation has to be the increased money supply from 2020, when countries raised public debt to pay compensation for the damage caused by lockdowns.
The pandemic has challenged many long-held beliefs. Individual agency was subordinated. Societies formerly known as liberal reorganised themselves entirely, arguably in an totalitarian attempt to reach a single goal, namely curbing the spread of SARS-CoV-2. Now, restrictions are being rolled back even in the last strongholds of lockdowns and most of the world has returned to its pre-2020 set of rules.
Many have lost their lives, to the virus or to the socioeconomic fallout of ‘the pandemic’, which cannot merely be understood as a disease outbreak but as an event of extraordinary social change and crisis. Many lives have been unsettled, leaving millions poorer, unhealthier, traumatised. Many, among them supporters and opponents of lockdowns alike, feel an urge to move on and not look back. While this may be a healthy decision for individuals, it would be a lost opportunity for mankind. Especially in the development sphere, too much of the pre-2020 consensus was disrupted and has not been properly discussed in the process nor evaluated in retrospect.
Many questions arise: Do we still think it is important for children to go to school? Why have most developing countries imposed the same restrictions as the rich world despite entirely different age structures, economic conditions, and epidemiological trajectories? Lockdowns have set a precedent. So have year-long school closures. Vaccine mandates and rules on facial coverings have existed before, the latter usually for religious reasons. Yet, their acceptance and application expanded enormously in the past three years.
WHO and other big players in public health are now working on their new pandemic preparedness plans, incorporating many of the policies that became normalised in the past three years. But policies such as lockdowns and school closures affect every aspect of society. Whether or not such policies should be part of the toolkit of governments is a question that needs to be discussed throughout societies. It is a question of what we value and in what kind of world we want to live – a question that, by its nature, cannot be left to ‘the experts’.
Judging by the pre-pandemic ‘old normal’, lockdowns and many other pandemic policies had been outside the window of discourse. Especially in the development field, we valued not only health (let alone only old people’s health), but also education, economic prosperity and much more. For many, individual rights and liberties have a high value in themselves, not least in times of crisis. While our constitutions and our international agreements remain unchanged in their wording, 2020 has certainly meant a reinterpretation of, for example, liberal, humanist values.
Neglecting the needs of the youngest in the purported interest of the oldest contradicts pre-pandemic morals, too. This is demonstrated by evidence from the Moral Machine Experiment, an online experiment of millions of participants from 233 countries and territories[33]. In a hypothetical moral dilemma where an automated car has to decide whether to run over a child or an old person (a ‘trolley problem’), a majority had a strong preference to save the child. Yet, the closures of schools, kindergartens, playgrounds and sports clubs made the lives of billions of children harder, and ended some unlucky ones prematurely.
A record number of children and youths have suffered from mental distress and in poorer families, cancelled school meals were not always substituted at home. It was clear from the early data, such as from Northern Italy, that SARS-CoV-2 poses no significant risk to the health of children beyond what has been accepted as normal for decades. So why have societies all over the globe imposed such suffering on the youngest in the supposed interests of the oldest? This is a question that needs to be discussed open-endedly and with mutual respect.
Experiments such as the Moral Machine have also highlighted that in some cultures, particularly in East Asia, the life of an older person is not valued less than the life of a younger person. There may be a moral case for a meritocracy where the old and merited come first. It is inconsistent, however, to highlight the wellbeing and education of the youngest as major goals of public policy, while at the same time leaving open the possibility to close schools for years, without even agreeing on clear benchmarks for determining the length of school closures nor having any solid evidence of their effectiveness. Even when we acknowledge that public morals changed in a way consistent with lockdowns and school closures, there is no good evidence for these policies actually reaching their goal of saving lives.
Each and every one of us must reflect on our values to be prepared for the next crisis. Ultimately, human development is not just about statistics. In the framework applied by the UNDP before 2020, development is about increasing human capabilities. This ultimately includes upholding human rights and individual dignity. The past years provided many impulses for every one of us to reflect on our own values and to pursue our own personal development. Improvement requires reflecting on past mistakes, even where it may be hurtful. This holds for individuals and institutions alike. Blaming external factors such as the pandemic, wars, or climate change does not help us to become better versions of ourselves.
References
- https://doi.org/10.18356/9789210016407
- https://www.nature.com/articles/d41586-022-01387-7
- https://www.mckinsey.com/industries/healthcare-systems-and-services/our-insights/covid-19-saving-thousands-of-lives-and-trillions-in-livelihoods
- https://papers.ssrn.com/sol3/papers.cfm
- https://population.un.org/wpp/Download/Standard/MostUsed/
- https://www.theguardian.com/australia-news/2022/dec/09/two-thirds-of-15400-extra-australian-deaths-in-2022-caused-by-covid-study-finds
- https://softwaredevelopmentperestroika.wordpress.com/2021/01/15/final-report-on-swedish-mortality-2020-anno-covid/
- https://covidtracker.bsg.ox.ac.uk/, data from Our World in Data: https://github.com/owid/covid-19-data/raw/master/public/data/owid-covid-data.csv
- https://cdn.wfp.org/2020/school-feeding-map/
- https://observer.ug/news/headlines/72687-how-covid-19-lockdown-spiked-teenage-pregnancy
- https://www.nbcnews.com/health/health-news/25-million-children-missed-routine-vaccinations-covid-rcna38385
- https://www.who.int/teams/global-malaria-programme/reports/world-malaria-report-2022
- https://www.euromomo.eu/graphs-and-maps/
- e.g. https://doi.org/10.1080/09645292.2018.1484426
- https://www.mirror.co.uk/news/ten-year-life-expectancy-gap-23771904
- https://www.rki.de/DE/Content/Gesundheitsmonitoring/Gesundheitsberichterstattung/GBEDownloadsJ/Focus/JoHM_01_2019_Mortalitaet_Lebenserwartung.pdf?__blob=publicationFile
- https://covid19.uis.unesco.org/school-closures-survey/
- e.g. https://blogs.lse.ac.uk/politicsandpolicy/rising-school-absences-the-post-pandemic-education-divide/
- https://data.worldbank.org/
- https://de.statista.com/statistik/daten/studie/1241071/umfrage/alter-bei-coronainfektionen-hospitalisierungen-und-todesfaellen-in-deutschland
- https://www.ons.gov.uk/peoplepopulationandcommunity/birthsdeathsandmarriages/deaths/datasets/singleyearofageandaverageageofdeathofpeoplewhosedeathwasduetoorinvolvedcovid19
- https://www.oxfam.org/en/press-releases/ten-richest-men-double-their-fortunes-pandemic-while-incomes-99-percent-humanity
- https://blogs.worldbank.org/opendata/pandemic-prices-and-poverty
- https://www.rki.de/DE/Content/Gesundheitsmonitoring/Gesundheitsberichterstattung/GBEDownloadsJ/Focus/JoHM_01_2019_Mortalitaet_Lebenserwartung.pdf?__blob=publicationFile
- https://www.mirror.co.uk/news/ten-year-life-expectancy-gap-23771904
- https://collateralglobal.org/article/the-power-of-a-good-example-nicaragua-and-the-covid-response/
- https://apps.who.int/nha/database/ViewData/Indicators/en
- https://hdr.undp.org/system/files/documents/hdr2020pdf.pdf
- https://data.worldbank.org/indicator/DT.ODA.ODAT.GN.ZS?most_recent_value_desc=true
- https://www.google.com/covid19/mobility/
- https://doi.org/10.18356/9789210018098
- https://ourworldindata.org/excess-mortality-covid
- https://www.americaninno.com/wp-content/uploads/2017/05/The-MM-Experiment.pdf