Thursday, 15 October 2020
Introduction
There is a persistent narrative that South Africa’s official COVID-19 death tally is significantly undercounted because reported excess deaths are higher than the official COVID-19 death toll. It is time to dispel the three most prominent myths around South Africa’s excess death reporting.
Myth 1: Excess Deaths are Real Deaths
It would be logical to think that excess deaths are the difference between the average deaths over the last twenty odd years and the actual deaths that have occurred. This is not what excess death refers to in South Africa.
Government doesn’t like to use data from as far back as 20 years because we have some skeletons in our closet relating to government’s AIDS denialism. During the mid-2000’s, AIDS-related deaths were averaging 250,000 a year. Government argues that including these numbers in the average mortality is unrealistic given the strides made in dealing with HIV (once the Presidency began listening to scientists it had until then tried to marginalise). The counter-argument of course is that our government has a history of incompetence in dealing with health crises and that this track record should be reflected in the excess deaths calculation.
ANC Ministers also have a history of using health crises to steal money. The Sarafina case comes to mind in which Minister Nkosazana Dlamini-Zuma was found to have lied to Parliament about funding for the Sarafina AIDS project, ignored proper bidding processes and supported a “quack remedy” called Virodene that turned out to be an industrial solvent.
The “actual deaths” number also includes deaths that are not recorded (such as deaths of undocumented immigrants). The result is that we do not in fact have an exact number of excess deaths and what should be reported is a range of deaths, for example, 26,000 to 45,000.
Myth 2: All Official COVID-19 Deaths are Excess Deaths
We know by now that those who are most likely to die from COVID-19 are the elderly, those with at least one severe comorbidity, and the terminally ill. Over a six-month reporting period, many of the reported COVID-19 deaths would have been expected to die of some or other cause, and they would therefore have been expected in the base deaths for the country. These deaths are therefore not excess deaths. Government does not, however, remove them from the calculation so effectively they are counted twice.
The phenomenon of ‘death with covid’ as opposed to ‘death from covid’ exacerbates the problem. Many people who in fact died from other causes but tested positive for COVID-19 have been counted in the official COVID-19 death numbers although it was not the virus that caused their death. Terminally ill cancer patients and car accident victims have been listed as COVID-19 deaths. It is illogical to simply conclude that every single official COVID-19 death is an additional death that would not have occurred without COVID-19. Although this is not what the South African Medical Research Council (SAMRC) says about its own figures in the media, in their calculations this is the premise they make.
Myth 3: Most Excess Deaths are COVID-19 Deaths
As at 29 September 2020, the excess deaths from natural causes were reported as being either 45,212 (table 1 – MRC report) or 38,402 (table 2 – MRC report) while at the same point the official COVID-19 death toll was 16,714. If most of these deaths are COVID-19 deaths, the suggestion is that two out of every three COVID-19 deaths are being missed in the official number. This narrative is not supported by the facts.
Our intense and singular focus on COVID-19 since April
COVID-19 deaths are not instantaneous, patients become progressively ill over 10-14 days. In order for two out of every three COVID-19 deaths to have been missed, tens of thousands of people would have gotten very sick and then died without any of them crossing paths with the healthcare services or being diagnosed during a time when every health resource in the country was dedicated to this singular disease.
Official figures have been patchy for community screening but they do suggest that over half the population has been directly engaged with a view to establishing the possibility of an infection. As at 13th October 2020, South Africa had carried out in excess of 4.4 million tests. It is simply not plausible that two out of every three people who became sick enough from COVID-19 to die were missed in this testing frenzy.
Countries, such as the United Kingdom, that were able to more accurately determine the cause of excess deaths estimated 6,000 non-COVID-19 excess deaths during the peak period as a result of people not going to hospital when they should have.
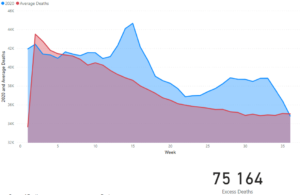
Mysterious Western Cape Double Peak
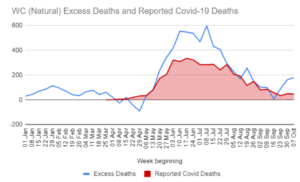
Looking at this data provided by the SAMRC, one can see two distinct peaks – the first occurring approximately mid-June and the second occurring in the second week of July. The first peak of excess deaths aligns well with the peak of reported official COVID-19 deaths while the second peak does not. Official COVID-19 deaths showed a very predictable decrease in deaths after the June peak, with no “second COVID-19 death peak” thereafter.
Hospital demand in the Western Cape peaked through June, in line with official deaths, and started to ease in July – as the second peak of excess deaths was occuring. This second peak refutes the suggestion that most or all of the excess deaths are COVID-19 deaths.
Major cities behaving badly
When examining the official excess deaths data it seems odd that Cape Town had more excess deaths than the whole of the Western Province combined in the 2 weeks starting 13th May. Gauteng metros, not to be outdone, managed this feat in the week beginning 23rd September.
We would expect the metros to be major contributors to the excess death numbers in a province, anything else would be a divergence from world experience. But for the metros to oscillate in their contribution to provincial totals is simply a stretch. As one example, could Cape Town contribute 46% of excess deaths in the Western Cape in the week starting 26th August (well past their peak) and 82% of the province’s deaths in the week following?
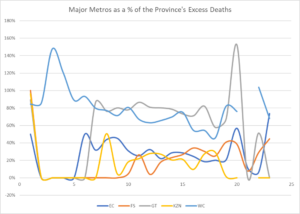
One might well ask if any of the metros have behaved in a manner consistent with simple logic, or has the estimation methodology employed simply run amok with no-one checking the outcomes.
Coordination of Peaks by Major Provinces
According to government, most provinces (and all of the most populous provinces: Western Cape, Eastern Cape, Gauteng and KZN) had their excess death peak within one week of each other. Based on reported cases, death and hospitalisation data, we know that the Western Cape experienced its COVID-19 wave approximately 4 to 6 weeks ahead of the rest of the country.
The Western Cape’s purported second excess deaths peak coincides within a week of the other major provinces around the second week of July. No second COVID-19 wave was picked up in cases, hospitalisations or deaths. This second wave clearly did not occur.
Hospital Demand is later than Excess Deaths
Other than in the Western Cape, most other provinces experienced peak cases and hospitalisation (including ICU usage) demand in the first week of August, with peak official COVID-19 deaths coming within a fortnight thereafter (as expected).
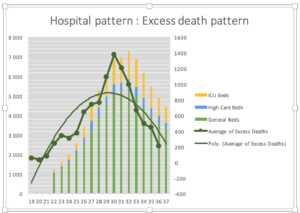
However, according to government’s excess deaths data, the peak COVID-19 deaths (assuming most excess deaths are COVID-19) occurred at least a full two weeks before the hospital admissions and ICUs peaked and a further two full weeks before official reported COVID-19 deaths occurred. It cannot therefore be that excess deaths are COVID-19 deaths.
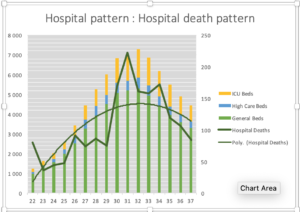
The graph above maps hospital demand data to hospital COVID-19 death data. As expected, the hospital death peak coincides with the demand for hospital usage. And this hospital death peak occurs three weeks after the excess death peak suggesting something else caused the excess deaths.
The Excess Deaths have stopped for the past five weeks
For the past five weeks, the excess deaths reported have been within what would be considered the normal range. We observe that people have largely returned to normal since lockdown levels four and five were lifted, including presenting to hospitals and healthcare facilities with their illnesses. This wasn’t happening during lockdown levels 1, 2 and 3, and as such people were dying at home to a much greater extent than normal. These avoidable deaths across all provinces in a similar timeframe, are directly as a result of lockdown itself and our decision to dedicate all healthcare resources towards COVID-19.
A better explanation
South Africa experienced two waves. A COVID-19 wave which passed through South Africa with delays between provinces possibly exceeding six weeks. This wave, and the pace of the wave is clear by looking at the hospital surveillance data across provinces, looking at case positivity rates across provinces (and positive numbers themselves) and most importantly looking at reported deaths across provinces.
The second wave of deaths had nothing directly to do with COVID-19, and was rather a wave set in motion by the hardest lockdown months in April and May 2020. This wave hit the country and its people in a more uniform manner, given the uniform timing of the lockdown, thereby resulting in excess deaths happening across the country in a consistent pattern measured by time.
Lockdown disrupted the actual reporting of deaths. While there is a requirement to report deaths to Home Affairs or to Law Enforcement, these avenues were closed to most by the requirements of Lockdown. Although it is claimed that deaths are recorded by date of occurrence rather than date of reporting, it is reasonable to speculate that accuracy has been found wanting.
A better explanation for the two waves that are reflected in the excess death numbers is that the first wave represents COVID-19 deaths and the second wave represents lockdown deaths. One wave was unavoidable. The second is completely self-inflicted.
Lockdown Deaths
As has been shown in data emerging from other countries, the number of cardiac deaths, sudden cardiac arrests, non-communicable disease complications, and cancer treatment delays have increased significantly during the pandemic, most especially in localities with hard lockdowns. Both the fear created and a culture of exceptionalism in the healthcare approach to a single pathogen has caused never before seen deprivation of medical access, as well as mass treatment defaulting. As an example, deaths in the United States of America that are not COVID-19 related have spiked sharply.
Missed Elective Surgeries
A survey on visits to a clinic or hospital during the hard lockdown revealed that 57% of people who needed hospital care in South Africa were apprehensive. Consider that an average hospital performs approximately 30 elective surgeries per day, or conservatively 150 elective surgeries per week. In South Africa, we have in excess of 500 hospitals, which would imply at least 75,000 missed elective surgeries per week.
Given that elective surgeries were prohibited through a large part of our lockdown period, it is reasonable to believe that over 750,000 elective surgeries that would have been performed during normal circumstances were not performed because of our lockdown.
Although categorised as “elective”, many of these procedures are life-saving and the vast majority would be medically necessary.
This estimate of missed surgeries are supported by the data supplied by two medical schemes. In the 2020 Momentum Metropolitan results presentation, their medical scheme members hospital admissions were significantly down between April (60% lower than the previous year) and July (42% lower than the previous year).
Discovery reported that 51% fewer mammograms were performed when compared to the same period last year and there were 44% fewer breast cancer diagnoses as a result. What was also alarming was a reduction in diabetes registrations of 19% year on year.
Missed Cancer Diagnosis
According to CANCA we diagnose approximately 115,000 cancer patients per year – close to 10,000 per month. The majority of cancer diagnoses are confirmed through a biopsy which is considered an elective surgery. Given that these were prohibited through much of our lockdown, tenss of thousands of cancer diagnoses will have been missed to date, causing a backlog which will be very difficult to clear.
It is established knowledge that earlier cancer detection, diagnosis and subsequent treatment leads to better health outcomes. In general cancer is not an instant killer, and therefore it is unlikely the majority of excess deaths are as a result of missed cancer diagnosis. However, it is worth bearing in mind that this is an additional cost of the lockdown which will be paid for in lives in the years to come.
Suicide and Mental Illness
Anxiety, depression and other mental illnesses are known to cause poor health. Calls to suicide lines in our country have increased dramatically. Research by the American Centre for Disease Control shows that 1 in 4 young adults in the United States of America considered suicide due to the lockdown.
HIV and TB impacts
A survey in South Africa showed that 13.2% of individuals who need medication for chronic diseases found that medication to be inaccessible during the hard lockdown.
South Africa ranks among the worst-affected countries in the world for both HIV and TB. Despite having just 0.7% of the world’s population, South Africa is home to ∼20% (7.7 to 7.9 million people) of the global HIV infections and ranks among the worst affected countries in the world for TB, with the fourth highest rate of HIV-TB co-infection (59%). HIV and TB polymerase chain reaction (PCR) tests are key to treatment initiation and monitoring, yet the equipment and expertise were diverted to COVID-19. Early reports suggested a 59% drop in the median number of daily GeneXpert TB tests was accompanied by a 33% reduction in new TB diagnoses. Delayed HIV and TB testing impedes initiation of appropriate treatment, which increases the risk of new infections and drug resistance. Interruptions of the drug treatment are widely known to have deleterious effects on patient outcomes. A significant surge in Multiple Drug Resistant TB seems inevitable and could be a lasting, ghastly, outcome.
Conclusion
In short, the method for calculating excess deaths in South Africa is controversial. We will not know how many of those deaths were actually COVID-19 deaths for some time. At this stage, all indicators suggest that lockdown has led to an increase in deaths and that this is what the excess death numbers tell us.
It was entirely foreseeable that lockdown would cause deaths, and these deaths should have been factored into government policy. The cure should not kill more people than the disease. Of course it would serve the government’s interests to blame these deaths on COVID-19 but there is no evidence to suggest that this is the case. In our country, lockdown-related deaths can reasonably be expected to represent a significant contributor to the total excess deaths.
Disclaimer
The materials published in this document are provided for general information purposes only and do not constitute advice. Panda accepts no liability or responsibility whatsoever if any information is, for whatever reason, incorrect, inaccurate or dated. Neither Panda nor the author of any work produced by Panda will be liable for any loss, damage or expense of whatever nature resulting directly or indirectly from access to or reliance on the information contained in these pages. No warranty is given that any files, downloads or applications available via this website are free of viruses which may have the ability to corrupt your system. Panda reserves the right to make changes to these Terms of Use and any information contained on this website at any time.